<?xml version="1.0" encoding="utf-8"?><feed xmlns="http://www.w3.org/2005/Atom" xml:lang="en"><generator uri="https://jekyllrb.com/" version="3.10.0">Jekyll</generator><link href="https://akmazad.github.io/blog/feed.xml" rel="self" type="application/atom+xml" /><link href="https://akmazad.github.io/" rel="alternate" type="text/html" hreflang="en" /><updated>2026-11-19T22:17:40+03:00</updated><id>https://akmazad.github.io/blog/feed.xml</id><title type="html">ADNS Lab</title><subtitle>The Advanced Data &amp; Network Science (ADNS) Lab, led by Dr AKM Azad at Imam Mohammad Ibn Saud Islamic University (IMSIU), Riyadh, develops Bayesian, network-science and AI methods for cancer systems biology, drug repositioning, trustworthy medical AI and global health analytics.</subtitle><author><name>AKM Azad</name></author><entry><title type="html">How pancreatic cancer cells escape dasatinib: a signalling cross-talk network analysis</title><link href="https://akmazad.github.io/blog/2026/dasatinib-resistance-cross-talk/" rel="alternate" type="text/html" title="How pancreatic cancer cells escape dasatinib: a signalling cross-talk network analysis" /><published>2026-02-23T00:00:00+03:00</published><updated>2026-02-23T00:00:00+03:00</updated><id>https://akmazad.github.io/blog/2026/dasatinib-resistance-cross-talk</id><content type="html" xml:base="https://akmazad.github.io/blog/2026/dasatinib-resistance-cross-talk/"><![CDATA[<p><strong>Acquired dasatinib resistance (ADR)</strong> undermines treatment of pancreatic cancer (PC). Prolonged exposure to the
drug drives <strong>dynamic reprogramming of signalling</strong>, so the question is not only <em>which</em> genes change, but how the
change <strong>spreads</strong> through interconnected pathways. This preprint (bioRxiv, 2026), with Muhammad J. A. Shiddiky and
Mohammad Ali Moni, introduces a cross-talk network model to map that spread.</p>

<!--more-->

<h2 id="data">Data</h2>

<p>Microarray profiles (Illumina HT-12 v4, GEO <strong>GSE59357</strong>) of three <strong>dasatinib-sensitive</strong> lines (Panc0504, Panc0403,
Panc1005) and three <strong>dasatinib-resistant</strong> lines (MiaPaCa2, Panc1, SU8686), each with three biological replicates.</p>

<h2 id="the-pipeline">The pipeline</h2>

<ol>
  <li><strong>Differential expression</strong> (limma with empirical Bayes): genes with \(|\log_2 \mathrm{FC}| \ge 1\) and
FDR \(\le 0.05\) are called DEGs.</li>
  <li><strong>Pathway enrichment and perturbation</strong> with <strong>SPIA</strong>, which combines two kinds of evidence: over-representation
of DEGs (a hypergeometric \(p_{\mathrm{NDE}}\)) and the perturbation that DEGs propagate through the pathway’s
signalling links. The total net accumulated perturbation of a pathway is
\(t_A = \sum_i \mathrm{Acc}(g_i)\), and its significance is assessed against bootstrap randomisations of both
topology and fold-changes, \(p_{\mathrm{PERT}} = \Pr(T_A \ge t_A \mid H_0)\).</li>
  <li><strong>Signalling cross-talk network.</strong> DEGs from the enriched pathways are linked to the pathways they belong to.
A <strong>cross-talking DEG</strong> is one that connects <strong>at least two pathways</strong>. The network is filtered to strongly
dysregulated nodes (\(|\log_2 \mathrm{FC}| \ge 2\)) and pruned of degree-1 nodes.</li>
  <li><strong>Hub prioritisation.</strong> <strong>Resistance biomarkers</strong> are the hubs with both <strong>high connectivity</strong> (the number of
pathways cross-talking through the gene) and <strong>high dysregulation</strong> (\(|\log_2 \mathrm{FC}|\)). Correlation and
Kolmogorov–Smirnov tests then characterise how hubs differ from the remaining genes.</li>
</ol>

<p>The intuition: a gene that is strongly perturbed <strong>and</strong> bridges many pathways is well placed to
<strong>disseminate</strong> the perturbation, acting as a hub or bottleneck that spreads resistance-associated signalling.</p>

<h2 id="what-we-found">What we found</h2>

<div class="keyfacts">
  <div><b>87%</b><span>of the global perturbation map orchestrated by two pathways</span></div>
  <div><b>10</b><span>key resistance biomarkers</span></div>
  <div><b>3</b><span>independent validation layers (TCGA, CPTAC, STRING)</span></div>
</div>

<ul>
  <li><strong>p53 signalling</strong> and <strong>Fc epsilon RI (FcεRI) signalling</strong> showed significant perturbation enrichment and,
working <strong>complementarily</strong>, accounted for <strong>87% of the global perturbation map</strong> in dasatinib resistance.</li>
  <li>Statistical characterisation of the cross-talk network identified <strong>10 key resistance biomarkers</strong>, including
<strong>THBS1, CDKN1A and BCL2L1</strong> within p53 signalling and <strong>RAC2 and MAPK13</strong> within FcεRI signalling.</li>
  <li>Validation against <strong>TCGA transcriptomics, CPTAC relative proteomics and STRING protein–protein interactions</strong>
for prognostic potential singled out <strong>BCL2L1</strong> as pivotal for spreading the global perturbation.</li>
</ul>

<h2 id="why-bcl2l1">Why BCL2L1?</h2>

<p>BCL2L1 encodes BCL-xL, an anti-apoptotic protein. Its position at the junction of the perturbed pathways makes it
both a <strong>mechanistic explanation</strong> for survival under dasatinib and a <strong>therapeutic hypothesis</strong>: co-targeting
BCL-xL (for example with BH3 mimetics) could re-sensitise resistant tumours. That is a hypothesis for experimental
follow-up.</p>

<h2 id="lineage">Lineage</h2>

<p>This study extends the cross-talk modelling we developed for
<a href="/blog/2015/bayesian-signalling-cross-talk-drug-resistance/">lapatinib resistance in breast cancer</a> to a new drug
and cancer type, and adds proteomic and clinical-cohort validation.</p>]]></content><author><name>AKM Azad</name></author><category term="acquired drug resistance" /><category term="pancreatic cancer" /><category term="dasatinib" /><category term="pathway cross-talk" /><category term="TCGA" /><category term="CPTAC" /><category term="biomarkers" /><summary type="html"><![CDATA[Coupling each gene's degree of dysregulation with the cross-talk between enriched pathways shows p53 and FcεRI signalling orchestrating 87% of the perturbation map in dasatinib resistance, and nominates BCL2L1 as a target.]]></summary><media:thumbnail xmlns:media="http://search.yahoo.com/mrss/" url="https://akmazad.github.io/assets/img/og-card.png" /><media:content medium="image" url="https://akmazad.github.io/assets/img/og-card.png" xmlns:media="http://search.yahoo.com/mrss/" /></entry><entry><title type="html">PlantCareNet: plant-disease diagnosis with dual-mode recommendations</title><link href="https://akmazad.github.io/blog/2025/plantcarenet/" rel="alternate" type="text/html" title="PlantCareNet: plant-disease diagnosis with dual-mode recommendations" /><published>2025-04-22T00:00:00+03:00</published><updated>2025-04-22T00:00:00+03:00</updated><id>https://akmazad.github.io/blog/2025/plantcarenet</id><content type="html" xml:base="https://akmazad.github.io/blog/2025/plantcarenet/"><![CDATA[<p>Plant diseases cut yields and threaten food security, and farmers often lack quick access to an expert who can
diagnose a disease <em>and</em> say what to do about it. <strong>PlantCareNet</strong>, published in <em>Plant Methods</em> with colleagues at
the University of Dhaka and IMSIU, is an end-to-end system that does both from a single leaf photograph.</p>

<!--more-->

<h2 id="dual-mode-design">Dual-mode design</h2>

<ol>
  <li><strong>Diagnosis (deep learning).</strong> A convolutional neural network examines the leaf image. The final convolutional
block is flattened and passed through fully connected layers (<strong>Dense-100 → Dense-35</strong>) to classify the disease
class.</li>
  <li><strong>Recommendation (knowledge base).</strong> Once a disease is identified, PlantCareNet immediately offers two kinds of
advice:
    <ul>
      <li><strong>automated suggestions</strong> derived from the identified symptoms; and</li>
      <li><strong>expert-guided advice</strong> for personalised treatment, drawn from a knowledge base curated with domain experts.</li>
    </ul>
  </li>
</ol>

<p>Pairing AI recognition with expert consultation is what makes the system actionable rather than just a classifier.</p>

<h2 id="results">Results</h2>

<div class="keyfacts">
  <div><b>5</b><span>public plant-disease datasets</span></div>
  <div><b>82–97%</b><span>accuracy across datasets</span></div>
  <div><b>97%</b><span>precision</span></div>
  <div><b>0.0021 s</b><span>average inference time</span></div>
</div>

<p>PlantCareNet <strong>outperformed well-known architectures such as Inception and ResNet</strong> in most cases, and surpassed
other lightweight CNNs, while remaining fast enough for real-time use on modest hardware.</p>

<h2 id="why-lightweight-matters">Why lightweight matters</h2>

<p>Large models are accurate but slow and expensive to deploy in the field. A compact CNN with millisecond inference
can run on phones or edge devices, putting <strong>rapid diagnosis and remedy</strong> in farmers’ hands, which supports more
sustainable agricultural practice.</p>]]></content><author><name>AKM Azad</name></author><category term="deep learning" /><category term="CNN" /><category term="plant disease" /><category term="agriculture" /><category term="decision support" /><summary type="html"><![CDATA[A lightweight CNN diagnoses plant diseases from leaf images (82–97% accuracy across five datasets, 2.1 ms inference) and returns both automated and expert-guided treatment advice.]]></summary><media:thumbnail xmlns:media="http://search.yahoo.com/mrss/" url="https://akmazad.github.io/assets/img/og-card.png" /><media:content medium="image" url="https://akmazad.github.io/assets/img/og-card.png" xmlns:media="http://search.yahoo.com/mrss/" /></entry><entry><title type="html">LandSin: privacy-preserving land-value estimation and habitability insights on the web</title><link href="https://akmazad.github.io/blog/2024/landsin-land-value/" rel="alternate" type="text/html" title="LandSin: privacy-preserving land-value estimation and habitability insights on the web" /><published>2024-11-01T00:00:00+03:00</published><updated>2024-11-01T00:00:00+03:00</updated><id>https://akmazad.github.io/blog/2024/landsin-land-value</id><content type="html" xml:base="https://akmazad.github.io/blog/2024/landsin-land-value/"><![CDATA[<p>Land-value estimates drive investment, taxation and regional planning, yet they are often opaque, slow to produce
and built on sensitive transaction data. <strong>LandSin</strong>, published in <em>Software Impacts</em> and developed in the lab with
collaborators, is a web application with a back-end database that makes land-value estimation <strong>fast,
explainable and privacy-preserving</strong>.</p>

<!--more-->

<h2 id="ingredients">Ingredients</h2>

<ul>
  <li><strong>Polynomial regression</strong> on property details and <strong>local amenities</strong>, capturing non-linear effects
(a generic polynomial model is shown below):</li>
</ul>

\[\hat{v} \;=\; \beta_0 + \sum_{k} \beta_k x_k + \sum_{k \le l} \beta_{kl}\, x_k x_l + \dots\]

<ul>
  <li><strong>Differential privacy (DP)</strong> to protect contributors’ data. A DP mechanism adds calibrated noise so that the
released outputs reveal almost nothing about any single record. Formally, a mechanism \(M\) is
\(\varepsilon\)-differentially private if, for neighbouring datasets \(D, D'\) and any output set \(S\),
\(\Pr[M(D)\in S] \le e^{\varepsilon}\Pr[M(D')\in S]\).</li>
  <li><strong>Google Maps integration</strong> for terrain context and location-aware features.</li>
</ul>

<h2 id="features">Features</h2>

<ul>
  <li>Land value and price <strong>prediction</strong> for a chosen location.</li>
  <li><strong>Affordability and habitability</strong> analysis.</li>
  <li><strong>Terrain insights</strong> from Google Maps.</li>
  <li><strong>Infographics</strong> that highlight economically deprived but habitable areas.</li>
</ul>

<h2 id="who-it-is-for">Who it is for</h2>

<ul>
  <li><strong>Real-estate agencies and investors:</strong> assess opportunities and market trends with data-driven estimates.</li>
  <li><strong>Community planners and governments:</strong> identify <strong>economically deprived yet habitable</strong> areas to target
balanced regional development.</li>
  <li><strong>Individuals:</strong> obtain informed estimates without exposing private data.</li>
</ul>

<p>LandSin shows how standard statistical models, combined with modern privacy guarantees and good interface design,
can become <strong>decision-support tools</strong> for the public sector, a direction the lab is pursuing with grants on
public-sector analytics.</p>]]></content><author><name>AKM Azad</name></author><category term="web server" /><category term="differential privacy" /><category term="regression" /><category term="urban planning" /><category term="Google Maps API" /><summary type="html"><![CDATA[A web application that pairs polynomial regression with differential privacy to estimate land values from local amenities, and adds affordability, habitability and terrain insights through Google Maps.]]></summary><media:thumbnail xmlns:media="http://search.yahoo.com/mrss/" url="https://akmazad.github.io/assets/img/og-card.png" /><media:content medium="image" url="https://akmazad.github.io/assets/img/og-card.png" xmlns:media="http://search.yahoo.com/mrss/" /></entry><entry><title type="html">rXTalkViz: quantifying and visualising functional cross-talk in R</title><link href="https://akmazad.github.io/blog/2024/rxtalkviz/" rel="alternate" type="text/html" title="rXTalkViz: quantifying and visualising functional cross-talk in R" /><published>2024-10-09T00:00:00+03:00</published><updated>2024-10-09T00:00:00+03:00</updated><id>https://akmazad.github.io/blog/2024/rxtalkviz</id><content type="html" xml:base="https://akmazad.github.io/blog/2024/rxtalkviz/"><![CDATA[<p>The standard post-omics workflow, <strong>differential expression followed by enrichment testing</strong>, tells you which
pathways or GO terms are over-represented, but treats each term <strong>in isolation</strong>. Tumour biology is not like that:
enriched pathways interact, and <strong>cross-talk among them</strong> helps explain the tumour microenvironment, metastasis and
drug resistance. No tool streamlined comprehensive functional cross-talk analysis. <strong>rXTalkViz</strong>, published in
<em>Software Impacts</em>, is an R package that does.</p>

<!--more-->

<h2 id="what-rxtalkviz-does">What rXTalkViz does</h2>

<ul>
  <li><strong>Quantifies</strong> cross-talk between enriched pathways or functional terms, using network-medicine ideas
(shared and interacting genes between terms; see our
<a href="/blog/2018/xdamosin-cross-talk-categorisation/">Type-I/Type-II categorisation</a>).</li>
  <li><strong>Visualises</strong> the resulting cross-talk network with a grammar-of-graphics approach (ggplot2-style), producing
<strong>publication-ready</strong> figures.</li>
  <li><strong>Reports</strong> the cross-talks in tidy tables for downstream analysis.</li>
</ul>

<h2 id="where-it-fits-in-a-pipeline">Where it fits in a pipeline</h2>

<div class="language-r highlighter-rouge"><div class="highlight"><pre class="highlight"><code><span class="c1"># Typical placement in an omics workflow</span><span class="w">
</span><span class="c1"># 1. Differential expression  -&gt;  list of biomarkers / DEGs</span><span class="w">
</span><span class="c1"># 2. Enrichment analysis      -&gt;  enriched pathways or GO terms</span><span class="w">
</span><span class="c1"># 3. rXTalkViz                -&gt;  quantified functional cross-talk + network figure</span><span class="w">
</span><span class="c1"># 4. Prioritise hub terms and bridging genes for follow-up</span><span class="w">
</span></code></pre></div></div>

<p>Because it works downstream of standard enrichment analysis, rXTalkViz slots into existing <strong>R</strong>
pipelines without reshaping the analysis.</p>

<h2 id="why-it-matters">Why it matters</h2>

<p>Pathway cross-talk is central to <strong>cancer progression and drug resistance</strong>, as our own work on
<a href="/blog/2015/bayesian-signalling-cross-talk-drug-resistance/">lapatinib</a> and
<a href="/blog/2026/dasatinib-resistance-cross-talk/">dasatinib resistance</a> shows. Making cross-talk analysis
routine, quantitative and visual helps researchers move from “these pathways are enriched” to “these pathways
<strong>talk to each other</strong>, through these genes”.</p>

<h2 id="get-it">Get it</h2>

<p>Source and installation instructions: <a href="https://github.com/Akmazad/rXTalkViz">github.com/Akmazad/rXTalkViz</a>.</p>]]></content><author><name>AKM Azad</name></author><category term="R package" /><category term="pathway cross-talk" /><category term="enrichment analysis" /><category term="network visualisation" /><category term="cancer biology" /><summary type="html"><![CDATA[An R package that goes beyond one-at-a-time enrichment tests by quantifying cross-talk between enriched pathways or functional terms and producing publication-ready network figures.]]></summary><media:thumbnail xmlns:media="http://search.yahoo.com/mrss/" url="https://akmazad.github.io/assets/img/og-card.png" /><media:content medium="image" url="https://akmazad.github.io/assets/img/og-card.png" xmlns:media="http://search.yahoo.com/mrss/" /></entry><entry><title type="html">Cyclosporine + selinexor against SARS-CoV-2: a network-medicine case for complementary exposure</title><link href="https://akmazad.github.io/blog/2024/cyclosporine-selinexor-network-medicine/" rel="alternate" type="text/html" title="Cyclosporine + selinexor against SARS-CoV-2: a network-medicine case for complementary exposure" /><published>2024-03-28T00:00:00+03:00</published><updated>2024-03-28T00:00:00+03:00</updated><id>https://akmazad.github.io/blog/2024/cyclosporine-selinexor-network-medicine</id><content type="html" xml:base="https://akmazad.github.io/blog/2024/cyclosporine-selinexor-network-medicine/"><![CDATA[<p>Two hallmark features of severe COVID-19 are <strong>enhanced viral replication</strong> and a subsequent <strong>cytokine storm</strong>.
Two existing drugs had each shown activity against SARS-CoV-2 through one of these routes:</p>

<ul>
  <li><strong>cyclosporine</strong>, an immunosuppressant (relevant to the cytokine storm);</li>
  <li><strong>selinexor</strong>, an inhibitor of the nuclear export protein XPO1 (relevant to viral replication).</li>
</ul>

<p>Because the pathology is multifactorial, a monotherapy is unlikely to be optimal. We asked whether
<strong>network medicine</strong> supports combining them.</p>

<!--more-->

<h2 id="the-framework">The framework</h2>

<p>All analyses run on an <strong>integrated human interactome</strong>. For each drug we define a <em>drug module</em> (its targets in the
network) and compare it with <strong>SARS-CoV-2 disease modules</strong> (host proteins perturbed by infection).</p>

<ol>
  <li><strong>Disease proximity:</strong> are a drug’s targets closer to the disease module than random target sets? We compute a
network distance and assess it against randomised expectations.</li>
  <li><strong>Functional proximity:</strong> do the drug and disease modules share enriched biological functions?</li>
  <li><strong>Topological separation</strong> between the two drug modules \(A\) and \(B\), for example with the separation measure widely used in
network medicine:</li>
</ol>

\[s_{AB} \;=\; \langle d_{AB} \rangle \;-\; \frac{\langle d_{AA} \rangle + \langle d_{BB} \rangle}{2},\]

<p>where \(\langle d_{AB}\rangle\) is the mean shortest distance between the two modules and \(\langle d_{AA}\rangle\) and
\(\langle d_{BB}\rangle\) are the within-module distances. A <strong>positive</strong> \(s_{AB}\) means the two drugs act on
topologically <strong>separate</strong> neighbourhoods.</p>

<p>All results are tested for statistical significance.</p>

<h2 id="findings">Findings</h2>

<ul>
  <li><strong>Both drug-target modules are highly proximal to SARS-CoV-2 disease modules</strong>, topologically and functionally,
and significantly so for each drug on its own.</li>
  <li><strong>Functional enrichment</strong> shows the two drugs target functions related to <strong>viral replication</strong> and
<strong>cytokine storm</strong>, respectively.</li>
  <li>The two drug modules are <strong>well separated</strong> in the network. Each drug hits the disease module, but from a different
side: a pattern known as <strong>complementary exposure</strong>, which network-medicine studies have associated with
effective combinations.</li>
</ul>

<h2 id="implication">Implication</h2>

<p>Cyclosporine plus selinexor is a rational candidate combination that warrants <strong>in vitro and in vivo testing</strong>, and
ultimately clinical evaluation. The analysis also illustrates the general workflow we first built into
<a href="/blog/2021/covid-cdr-combination-therapy/">COVID-CDR</a>, now being extended to cancer in the proposed <strong>Onco-CDR</strong>
platform.</p>]]></content><author><name>AKM Azad</name></author><category term="network medicine" /><category term="drug combination" /><category term="SARS-CoV-2" /><category term="interactome" /><category term="network separation" /><summary type="html"><![CDATA[Interactome-based proximity, functional proximity and topological separation show that cyclosporine and selinexor target complementary SARS-CoV-2 modules, viral replication and cytokine storm.]]></summary><media:thumbnail xmlns:media="http://search.yahoo.com/mrss/" url="https://akmazad.github.io/assets/img/og-card.png" /><media:content medium="image" url="https://akmazad.github.io/assets/img/og-card.png" xmlns:media="http://search.yahoo.com/mrss/" /></entry><entry><title type="html">COVIDSpread: real-time, customisable time-series forecasting of COVID-19 spread</title><link href="https://akmazad.github.io/blog/2021/covidspread-time-series/" rel="alternate" type="text/html" title="COVIDSpread: real-time, customisable time-series forecasting of COVID-19 spread" /><published>2021-11-03T00:00:00+03:00</published><updated>2021-11-03T00:00:00+03:00</updated><id>https://akmazad.github.io/blog/2021/covidspread-time-series</id><content type="html" xml:base="https://akmazad.github.io/blog/2021/covidspread-time-series/"><![CDATA[<p>During the pandemic, dashboards visualised COVID-19 case counts everywhere, but <strong>visualisation is not
prediction</strong>. Very few tools let people move from “what happened” to “what is likely to happen next week” using
the same real-time data. <strong>COVIDSpread</strong>, developed with Sahar Shahriari, Taha Hossein Rashidi and Fatemeh Vafaee at
UNSW and published in <em>F1000Research</em>, fills that gap.</p>

<!--more-->

<h2 id="design-goals">Design goals</h2>

<ol>
  <li><strong>Real-time:</strong> work from the latest available data.</li>
  <li><strong>Statistical, not just visual:</strong> fit forecasting models within the same platform used to explore the data.</li>
  <li><strong>Customisable:</strong> let users decide <em>which</em> part of the epidemic curve to model, for example only the period
after a lockdown began, because the dynamics change with interventions.</li>
  <li><strong>Accessible:</strong> usable by lay users and by experts.</li>
</ol>

<h2 id="models">Models</h2>

<p>Epidemic curves are rarely linear: growth accelerates, saturates and responds to interventions. COVIDSpread
therefore relies on <strong>time-series models able to capture non-linearity</strong>. A generic short-term forecast takes the
form</p>

\[\hat{y}_{t+h} \;=\; g\big(y_t, y_{t-1}, \dots, y_{t-p};\, \hat\theta\big), \qquad h = 1,\dots,H,\]

<p>where \(y_t\) is the (possibly transformed) count on day \(t\), \(g\) is the fitted model and \(H\) is a short horizon.
Users can develop <strong>several customised models with different restrictions</strong>, such as a model fitted only to a
chosen time window, and compare their forecasts side by side.</p>

<h2 id="why-time-windows-matter">Why time windows matter</h2>

<p>Fitting one model to the whole pandemic blends regimes: pre-intervention growth, lockdown decline and reopening
waves. Restricting the window to the current regime gives forecasts that reflect present dynamics. Comparing
windows is also a quick way to <strong>assess the effect of an intervention</strong>, which was the focus of our earlier medRxiv
preprint, <em>Real-time time-series modelling for prediction of COVID-19 spread and intervention assessment</em> (2020).</p>

<h2 id="access">Access</h2>

<p>The platform (originally released as “COVID-19 TS”) was hosted by the Vafaee Lab at UNSW and is no longer online.
The methodology and its evaluation are
described in the open-access paper below.</p>]]></content><author><name>AKM Azad</name></author><category term="COVID-19" /><category term="forecasting" /><category term="time series" /><category term="epidemiology" /><category term="R Shiny" /><summary type="html"><![CDATA[A unified platform that couples live COVID-19 data visualisation with non-linear time-series models that users can fit to any window of the data, for short-term forecasts.]]></summary><media:thumbnail xmlns:media="http://search.yahoo.com/mrss/" url="https://akmazad.github.io/assets/img/og-card.png" /><media:content medium="image" url="https://akmazad.github.io/assets/img/og-card.png" xmlns:media="http://search.yahoo.com/mrss/" /></entry><entry><title type="html">COVID-CDR: network pharmacology for prioritising COVID-19 drug combinations</title><link href="https://akmazad.github.io/blog/2021/covid-cdr-combination-therapy/" rel="alternate" type="text/html" title="COVID-CDR: network pharmacology for prioritising COVID-19 drug combinations" /><published>2021-07-12T00:00:00+03:00</published><updated>2021-07-12T00:00:00+03:00</updated><id>https://akmazad.github.io/blog/2021/covid-cdr-combination-therapy</id><content type="html" xml:base="https://akmazad.github.io/blog/2021/covid-cdr-combination-therapy/"><![CDATA[<p>SARS-CoV-2 pathology is <strong>multifactorial</strong>: viral replication, immune dysregulation, cytokine storm and tissue
injury. A single repurposed drug rarely hits enough of these at once, which is why <strong>combination therapy</strong> is
attractive. But how do you choose which two drugs to combine, from thousands of candidates, before any trial?
<strong>COVID-CDR</strong> (COVID-19 Combinatorial Drug Repositioning), published in <em>Patterns</em> (Cell Press), offers a systematic,
visual and quantitative answer.</p>

<!--more-->

<h2 id="the-network-pharmacology-view">The network-pharmacology view</h2>

<p>Everything is placed on one map, the <strong>human protein–protein interaction (PPI) network</strong>:</p>

<ul>
  <li>the <strong>SARS-CoV-2–host interactome</strong>, the human proteins that viral proteins bind or perturb;</li>
  <li>the <strong>primary targets</strong> of each candidate drug.</li>
</ul>

<p>A drug is a plausible COVID-19 candidate if its targets sit <strong>close</strong> to the virus–host module in the network. A
drug <em>pair</em> is a promising combination if the two drugs reach the disease module <strong>through different, potentially
complementary routes</strong>, covering more of the pathology with less redundancy.</p>

<h2 id="prioritising-pairs">Prioritising pairs</h2>

<p>A common way to formalise “close” in network medicine is the average shortest-path distance between a drug’s
targets \(T\) and a disease module \(S\), for example</p>

\[d(T,S) \;=\; \frac{1}{|T|}\sum_{t \in T} \min_{s \in S} \operatorname{dist}(t,s),\]

<p>compared against randomised target sets to obtain a z-score. COVID-CDR combines such topological relations between
each drug’s targets and the virus–host interactome with <strong>multi-evidence drug–drug similarity</strong> from
<a href="/blog/2020/drugsimdb/">DrugSimDB</a>. The goal is to surface pairs whose targets are individually relevant but
mechanistically <strong>complementary</strong> rather than redundant.</p>

<h2 id="what-the-platform-offers">What the platform offers</h2>

<ul>
  <li><strong>Interactive visualisation</strong> of drug targets, viral–host proteins and their paths in the PPI network.</li>
  <li><strong>Quantitative scores</strong> for individual drugs and drug pairs.</li>
  <li><strong>Multi-evidence drug-pair similarity</strong> breakdowns (chemical, target, functional, pathway).</li>
  <li>Supporting information on each drug and pair, so clinicians and researchers can check the rationale.</li>
</ul>

<p>To our knowledge COVID-CDR was the <strong>first online platform</strong> for systematic, pre-clinical in-silico investigation of
combination therapies for COVID-19.</p>

<h2 id="data-and-follow-ups">Data and follow-ups</h2>

<p>The full resource is archived on <strong>Dryad</strong> (<a href="https://doi.org/10.5061/dryad.905qfttjm">doi:10.5061/dryad.905qfttjm</a>),
with an earlier preprint on ChemRxiv. The same network-medicine logic led to our analysis of the
<a href="/blog/2024/cyclosporine-selinexor-network-medicine/">cyclosporine–selinexor combination</a> and the proposed
<strong>NovexSyn.ai</strong> project on synergistic antivirals for new variants.</p>]]></content><author><name>AKM Azad</name></author><category term="COVID-19" /><category term="combination therapy" /><category term="network pharmacology" /><category term="drug repositioning" /><category term="interactome" /><summary type="html"><![CDATA[An online platform that maps drug targets onto the SARS-CoV-2–host interactome inside the human PPI network to find drug pairs acting through different, complementary pathways.]]></summary><media:thumbnail xmlns:media="http://search.yahoo.com/mrss/" url="https://akmazad.github.io/assets/img/og-card.png" /><media:content medium="image" url="https://akmazad.github.io/assets/img/og-card.png" xmlns:media="http://search.yahoo.com/mrss/" /></entry><entry><title type="html">PathTurbEr: finding the driver genes of perturbed signalling pathways with causal Bayesian networks</title><link href="https://akmazad.github.io/blog/2021/pathturber-perturbation-drivers/" rel="alternate" type="text/html" title="PathTurbEr: finding the driver genes of perturbed signalling pathways with causal Bayesian networks" /><published>2021-03-24T00:00:00+03:00</published><updated>2021-03-24T00:00:00+03:00</updated><id>https://akmazad.github.io/blog/2021/pathturber-perturbation-drivers</id><content type="html" xml:base="https://akmazad.github.io/blog/2021/pathturber-perturbation-drivers/"><![CDATA[<p>Cancers hijack <strong>signal transduction pathways (STPs)</strong> to grow and resist therapy, but finding <em>which genes drive</em>
the aberration is hard. Differential expression tells us what changed, not what is <strong>causing</strong> the change.
<strong>PathTurbEr</strong> (Pathway Perturbation Driver), published in <em>Briefings in Bioinformatics</em> with Salem Alyami, combines
causal network learning and random-graph modelling to find drivers inside a perturbed pathway.</p>

<!--more-->

<h2 id="pipeline-at-a-glance">Pipeline at a glance</h2>

<div class="diagram" role="img" aria-label="PathTurbEr pipeline from expression data to perturbation drivers">
<svg viewBox="0 0 720 120">
  <rect class="d-box" x="5" y="35" width="130" height="50" rx="10" /><text x="70" y="58" text-anchor="middle" font-size="12">Expression data</text><text x="70" y="74" text-anchor="middle" class="d-small">sensitive vs resistant</text>
  <rect class="d-box" x="150" y="35" width="130" height="50" rx="10" /><text x="215" y="58" text-anchor="middle" font-size="12">DEGs + enrichment</text><text x="215" y="74" text-anchor="middle" class="d-small">perturbed STPs</text>
  <rect class="d-acc" x="295" y="35" width="135" height="50" rx="10" /><text x="362" y="58" text-anchor="middle" font-size="12">Causal BN of STP</text><text x="362" y="74" text-anchor="middle" class="d-small">NS · HAR · MH</text>
  <rect class="d-acc2" x="445" y="35" width="130" height="50" rx="10" /><text x="510" y="58" text-anchor="middle" font-size="12">p₁-model (ERGM)</text><text x="510" y="74" text-anchor="middle" class="d-small">structural features</text>
  <rect class="d-acc" x="590" y="35" width="125" height="50" rx="10" /><text x="652" y="64" text-anchor="middle" font-size="12">Driver genes</text>
  <path class="d-line" d="M135 60 H150 M280 60 H295 M430 60 H445 M575 60 H590" stroke-width="1.5" />
</svg>
</div>

<h2 id="step-1-find-the-perturbed-pathways">Step 1: find the perturbed pathways</h2>

<p>Using expression data from <strong>lapatinib-sensitive and lapatinib-resistant SKBR3</strong> breast cancer cells (lapatinib is a
dual EGFR/HER2 inhibitor), differential expression analysis found <strong>512 differentially expressed genes</strong>. Pathway
enrichment revealed <strong>13 highly perturbed signalling pathways</strong> in resistance, including <strong>PI3K–AKT, chemokine,
Hippo and TGF-β</strong> signalling.</p>

<h2 id="step-2-learn-the-causal-structure-of-the-perturbed-pathway">Step 2: learn the causal structure of the perturbed pathway</h2>

<p>The aberrant <strong>TGF-β pathway</strong> was modelled as a <strong>causal Bayesian network</strong>, with posterior</p>

\[\Pr(G \mid D) \;\propto\; \Pr(D \mid G)\,\Pr(G),\]

<p>sampled with three MCMC samplers: the <strong>Neighbourhood sampler (NS)</strong> and <strong>Hit-and-Run (HAR)</strong> sampler, which
yield robust inference with less risk of local optima and faster convergence, and <strong>Metropolis–Hastings (MH)</strong> as a
baseline. (See our posts on the <a href="/blog/2016/neighbourhood-sampler-bayesian-networks/">Neighbourhood sampler</a> and
<a href="/blog/2018/bnmcmc-software/">BNMCMC</a>.)</p>

<h2 id="step-3-ask-which-nodes-shape-the-network">Step 3: ask which nodes shape the network</h2>

<p>An optimal network is still just a graph; drivers are the nodes that <strong>shape its global structure</strong>. We treated
the learned BN as the output of a statistical generative process, the <strong>p₁-model</strong>, a special class of exponential
random graph model (ERGM) with node-level expansiveness and attractiveness parameters, and sampled its
hyper-parameters by MCMC. Genes whose parameters stand out are the ones that drive the aberration within the
perturbed pathway.</p>

<h2 id="results">Results</h2>

<div class="keyfacts">
  <div><b>80</b><span>genes in the TGF-β pathway model</span></div>
  <div><b>34 / 34 / 23</b><span>driver genes (NS / HAR / MH networks)</span></div>
  <div><b>13</b><span>perturbed signalling pathways</span></div>
</div>

<p>Functional-relevance and disease-relevance analyses showed that the drivers are significantly associated with
<strong>breast cancer progression and resistance</strong>. That makes them candidate biomarkers and co-targets to pair with
EGFR/HER2 inhibition.</p>

<h2 id="code">Code</h2>

<p>PathTurbEr is open source: <a href="https://github.com/Akmazad/PathTurbEr">github.com/Akmazad/PathTurbEr</a>.</p>]]></content><author><name>AKM Azad</name></author><category term="Bayesian networks" /><category term="MCMC" /><category term="ERGM" /><category term="p1-model" /><category term="biomarker discovery" /><category term="TGF-beta" /><category term="lapatinib resistance" /><summary type="html"><![CDATA[Causal Bayesian networks learned with Neighbourhood, Hit-and-Run and Metropolis–Hastings samplers, then analysed with the p₁-model, pinpoint perturbation drivers of TGF-β signalling in lapatinib-resistant breast cancer.]]></summary><media:thumbnail xmlns:media="http://search.yahoo.com/mrss/" url="https://akmazad.github.io/assets/img/og-card.png" /><media:content medium="image" url="https://akmazad.github.io/assets/img/og-card.png" xmlns:media="http://search.yahoo.com/mrss/" /></entry><entry><title type="html">DrugSimDB: a multi-modal drug–drug similarity network for in-silico drug repositioning</title><link href="https://akmazad.github.io/blog/2020/drugsimdb/" rel="alternate" type="text/html" title="DrugSimDB: a multi-modal drug–drug similarity network for in-silico drug repositioning" /><published>2020-06-29T00:00:00+03:00</published><updated>2020-06-29T00:00:00+03:00</updated><id>https://akmazad.github.io/blog/2020/drugsimdb</id><content type="html" xml:base="https://akmazad.github.io/blog/2020/drugsimdb/"><![CDATA[<p>Bringing a new drug to market takes over a decade and enormous investment. <strong>Drug repositioning</strong>, finding new
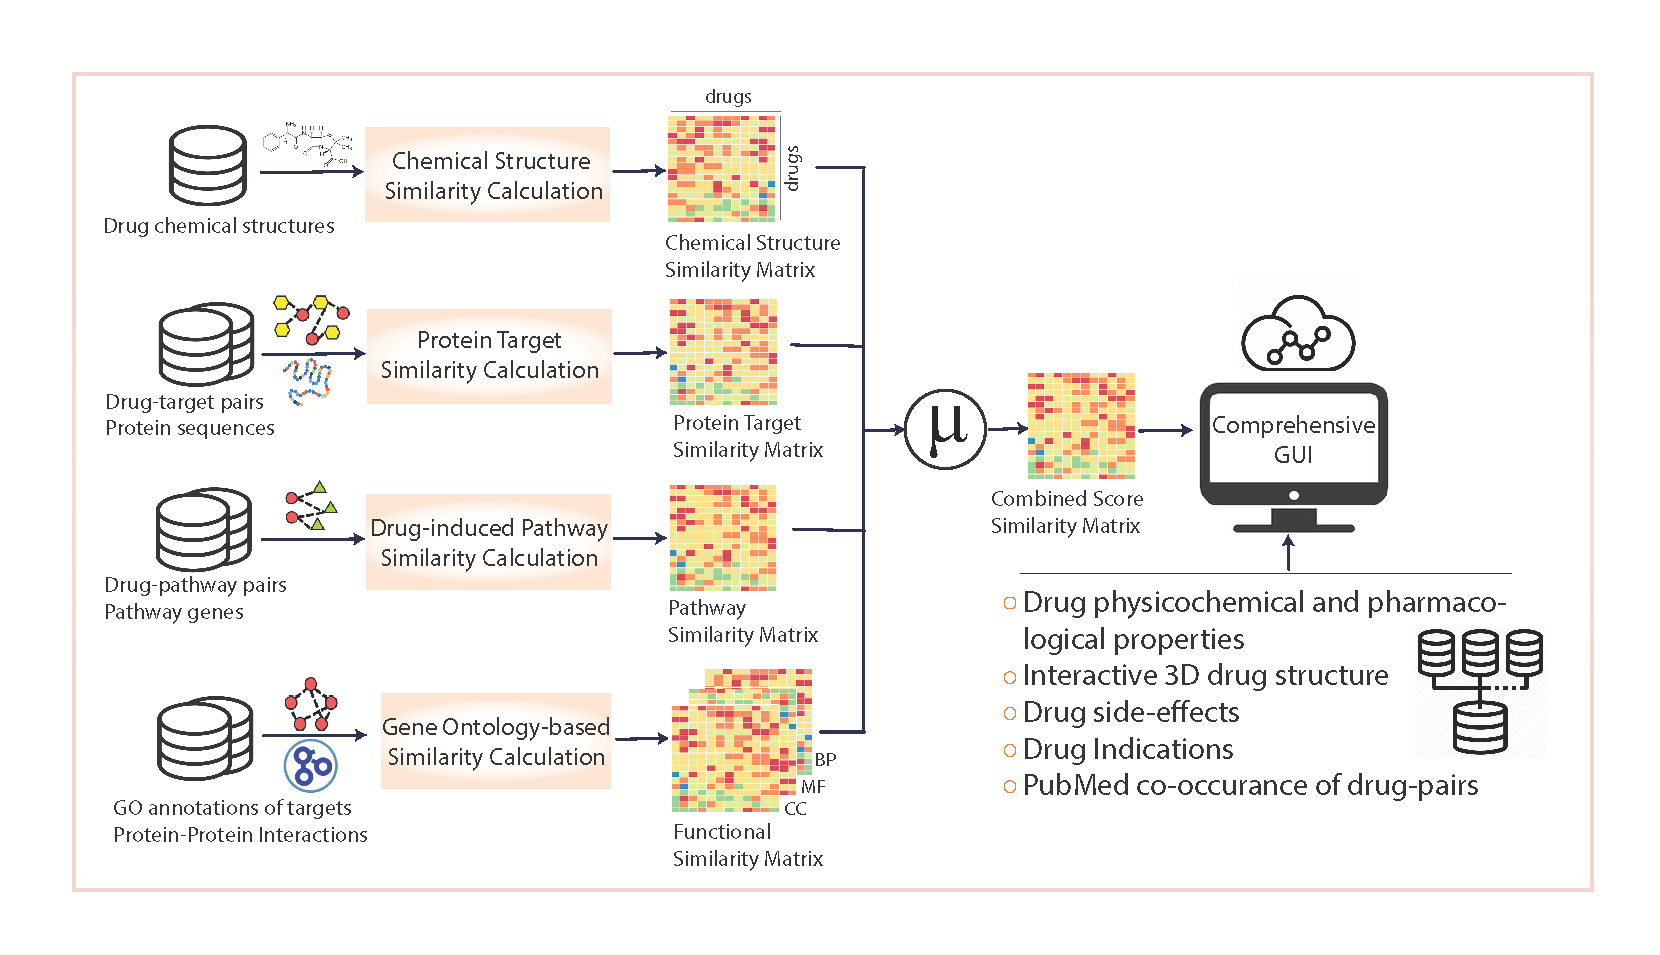
uses for existing drugs, shortcuts much of that because safety profiles are already known. Its guiding hypothesis is
simple: <strong>similar drugs should display similar therapeutic actions</strong>. The hard part is measuring “similar”. Existing
resources either covered few drugs or relied on a <strong>single source of evidence</strong>, such as chemical structure alone.
DrugSimDB, published in <em>Briefings in Bioinformatics</em>, closes that gap.</p>

<!--more-->

<h2 id="what-is-in-the-database">What is in the database</h2>

<div class="keyfacts">
  <div><b>10,367</b><span>small-molecule drugs</span></div>
  <div><b>238,635</b><span>drug pairs with significant aggregated similarity</span></div>
  <div><b>4</b><span>evidence modalities integrated</span></div>
</div>

<p>For every pair of drugs we compute similarity across complementary modalities:</p>

<ul>
  <li><strong>Chemical structure</strong>: molecular fingerprints and Tanimoto similarity;</li>
  <li><strong>Target protein sequence</strong>: how similar the drugs’ protein targets are;</li>
  <li><strong>Target function</strong>: Gene Ontology and protein–protein-interaction context of the targets;</li>
  <li><strong>Pathways</strong>: shared KEGG pathways and their constituent genes.</li>
</ul>

<p>The modalities are then <strong>aggregated</strong> into a single, multi-evidence similarity score, and significant pairs form
the DrugSimDB network.</p>

<figure>
  <img src="/images/drugsimdb_overview.png" alt="Schematic of DrugSimDB integrating chemical, target, functional and pathway similarity into a single network" loading="lazy" />
  <figcaption>Multi-layer integration of drug similarity measures into a unified resource.</figcaption>
</figure>

<h2 id="how-it-was-built">How it was built</h2>

<ol>
  <li><strong>Data collection</strong> from DrugBank, KEGG, I2D (protein interactions) and Enrichr libraries, with RepoDB and SIDER
for validation and side-effect context.</li>
  <li><strong>Computation</strong> of each similarity modality in R, parallelised for scale.</li>
  <li><strong>Integration</strong> of the similarity matrices into one multi-modal network.</li>
  <li><strong>Access</strong> through an interactive web interface and bulk downloads.</li>
</ol>

<p>The compilation code is documented and semi-automated, so the database can be <strong>rebuilt at any time</strong> as new drugs
and annotations appear, and further evidence types can be added to the integration.</p>

<h2 id="why-integration-helps">Why integration helps</h2>

<ul>
  <li><strong>Less sparsity.</strong> Many drugs lack one data type, for example an unknown target. Integration fills those gaps.
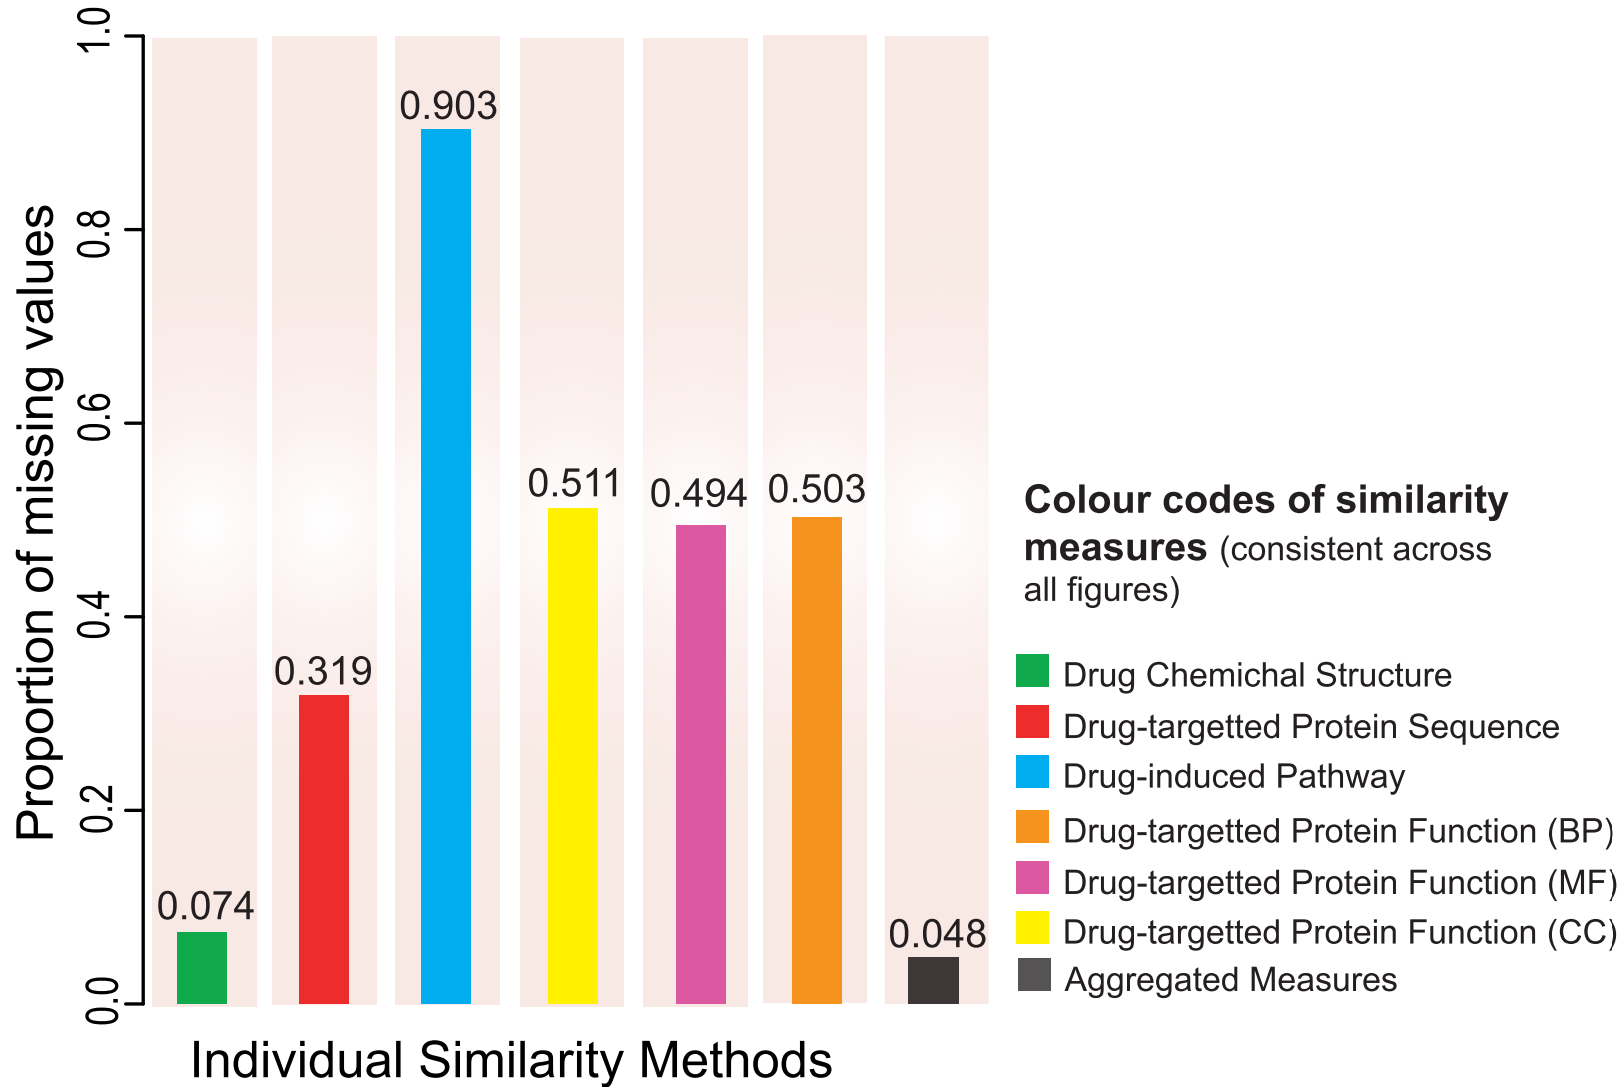
<img src="/images/drugSimDB_reducedDataSparsity.png" alt="Reduced data sparsity after integration" /></li>
  <li><strong>Network structure.</strong> The integrated similarity network is <strong>scale-free</strong>, like many biological networks:
a few hub drugs connect large neighbourhoods, which suits diffusion-based repositioning algorithms.
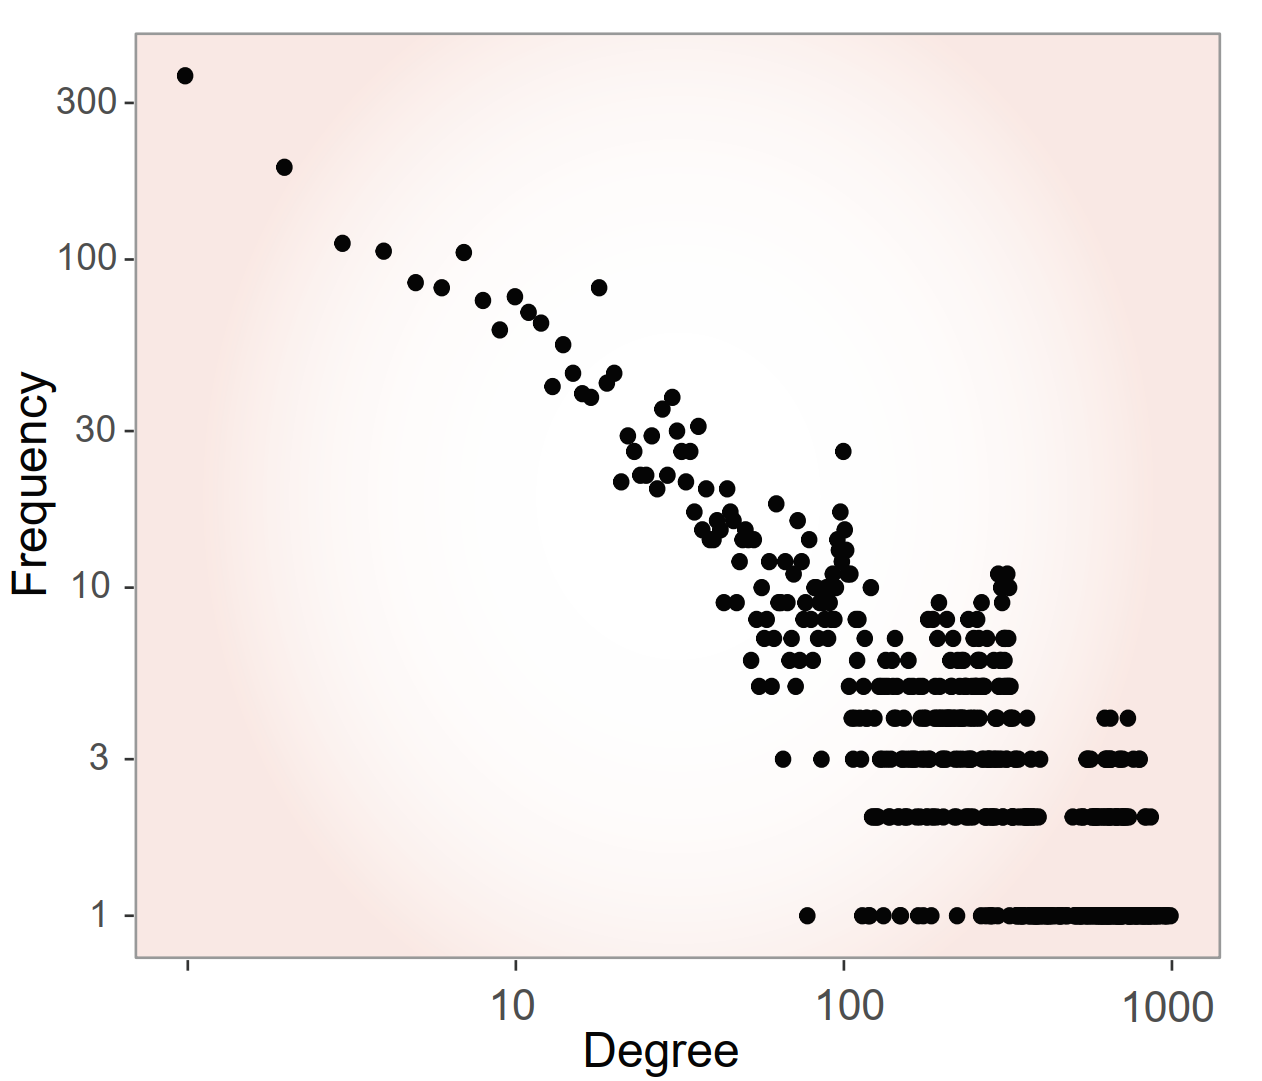
<img src="/images/drugSimDB_scalefree.png" alt="Degree distribution of the DrugSimDB network" /></li>
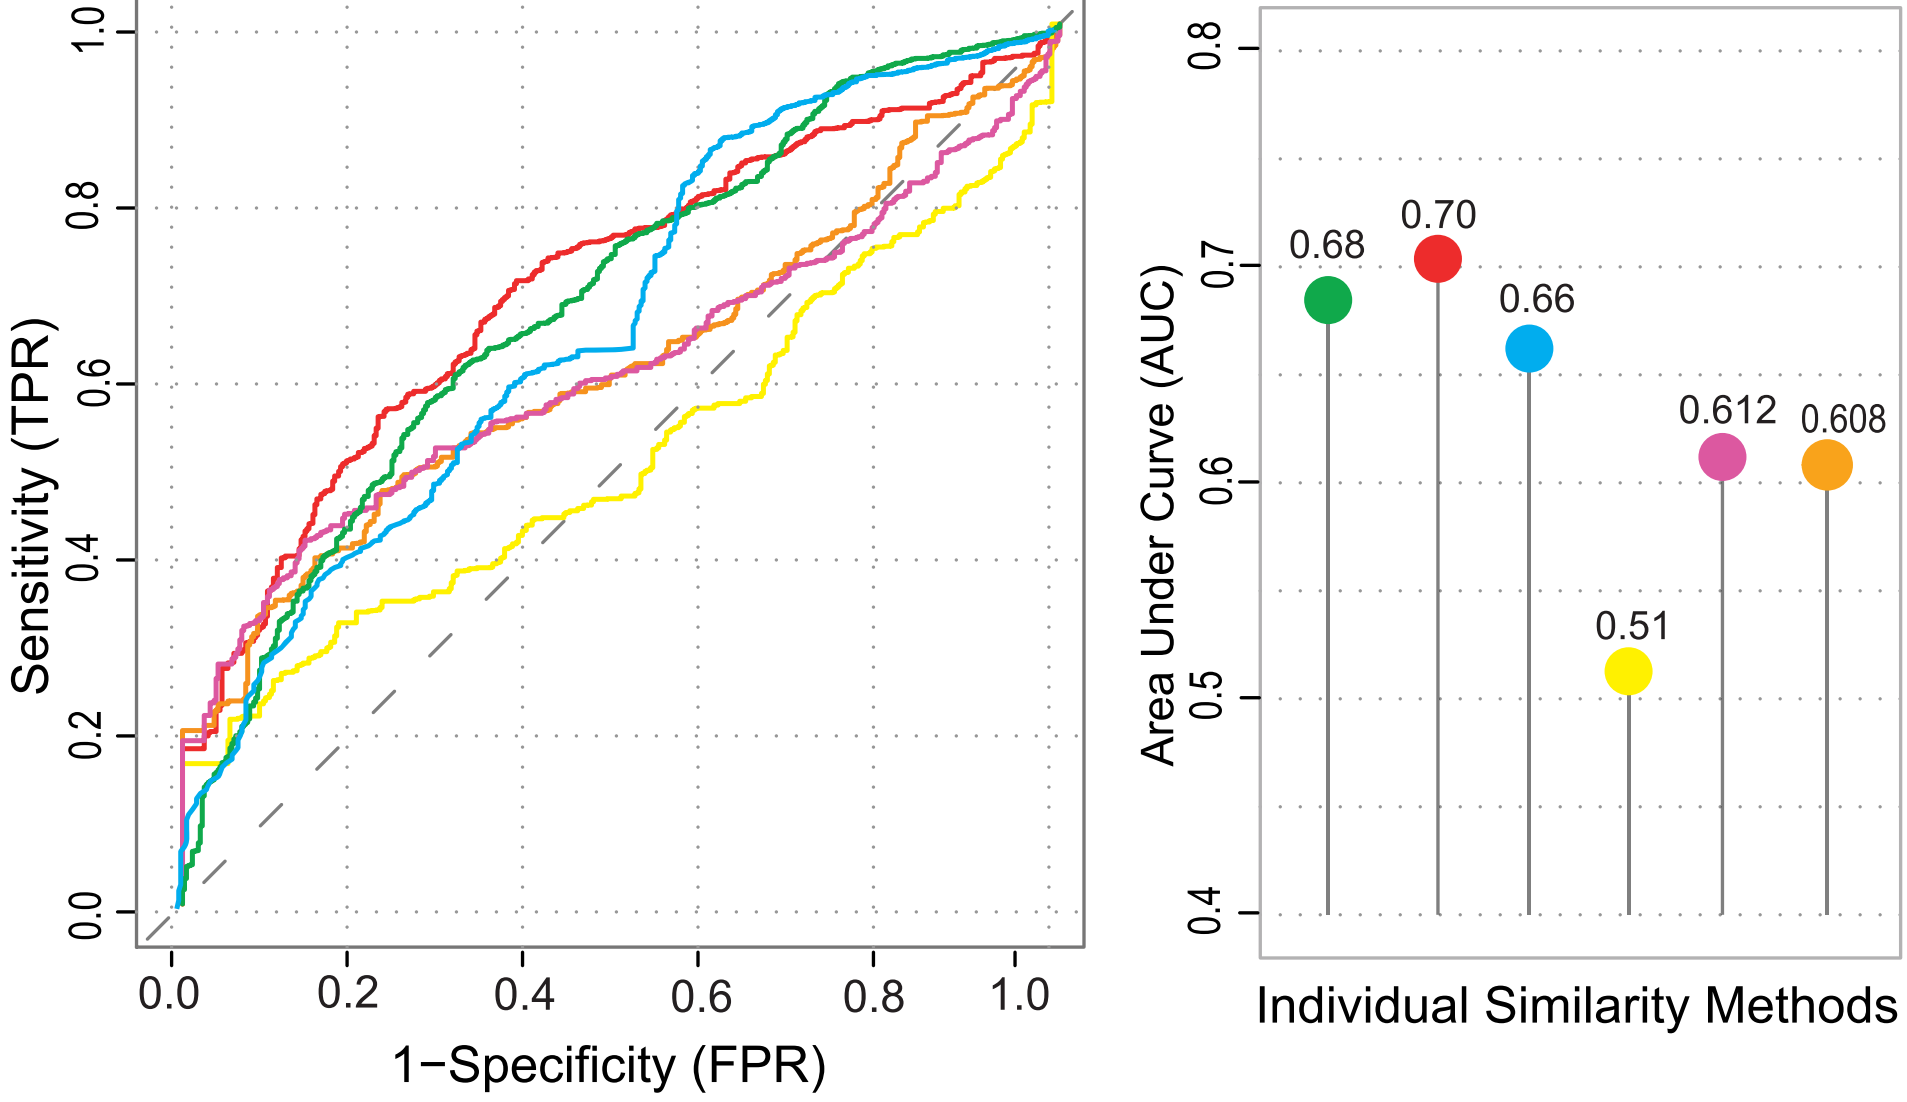
  <li><strong>Better repositioning performance.</strong> Multi-modal scores outperform the individual similarity measures when
benchmarked against known repositioning cases from RepoDB.
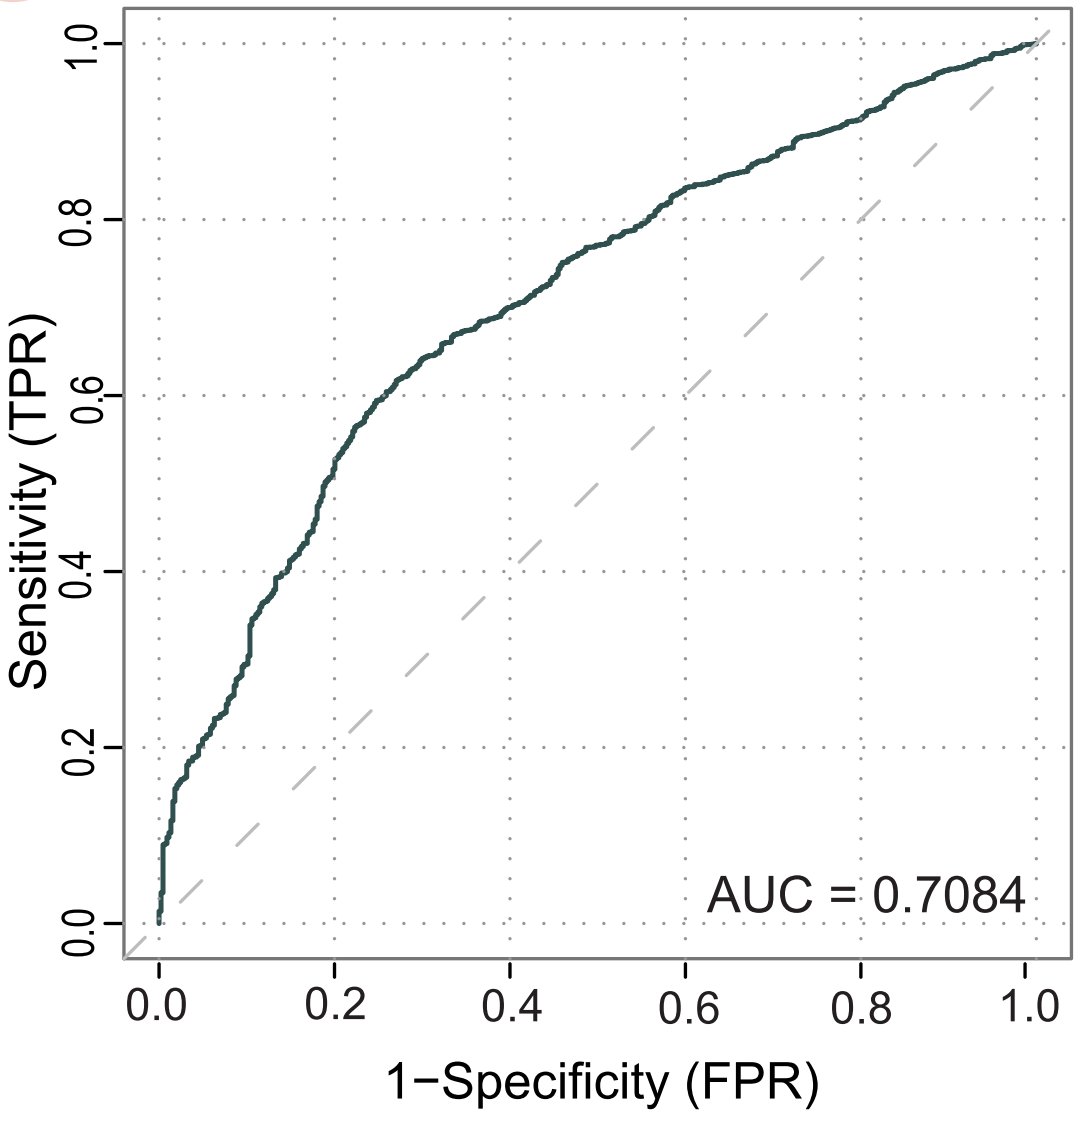
<img src="/images/drugSimDB_improvedPerformace.png" alt="Improved performance of the integrated score" />
<img src="/images/drugSimDB_auc.png" alt="ROC analysis of repositioning validation" /></li>
</ul>

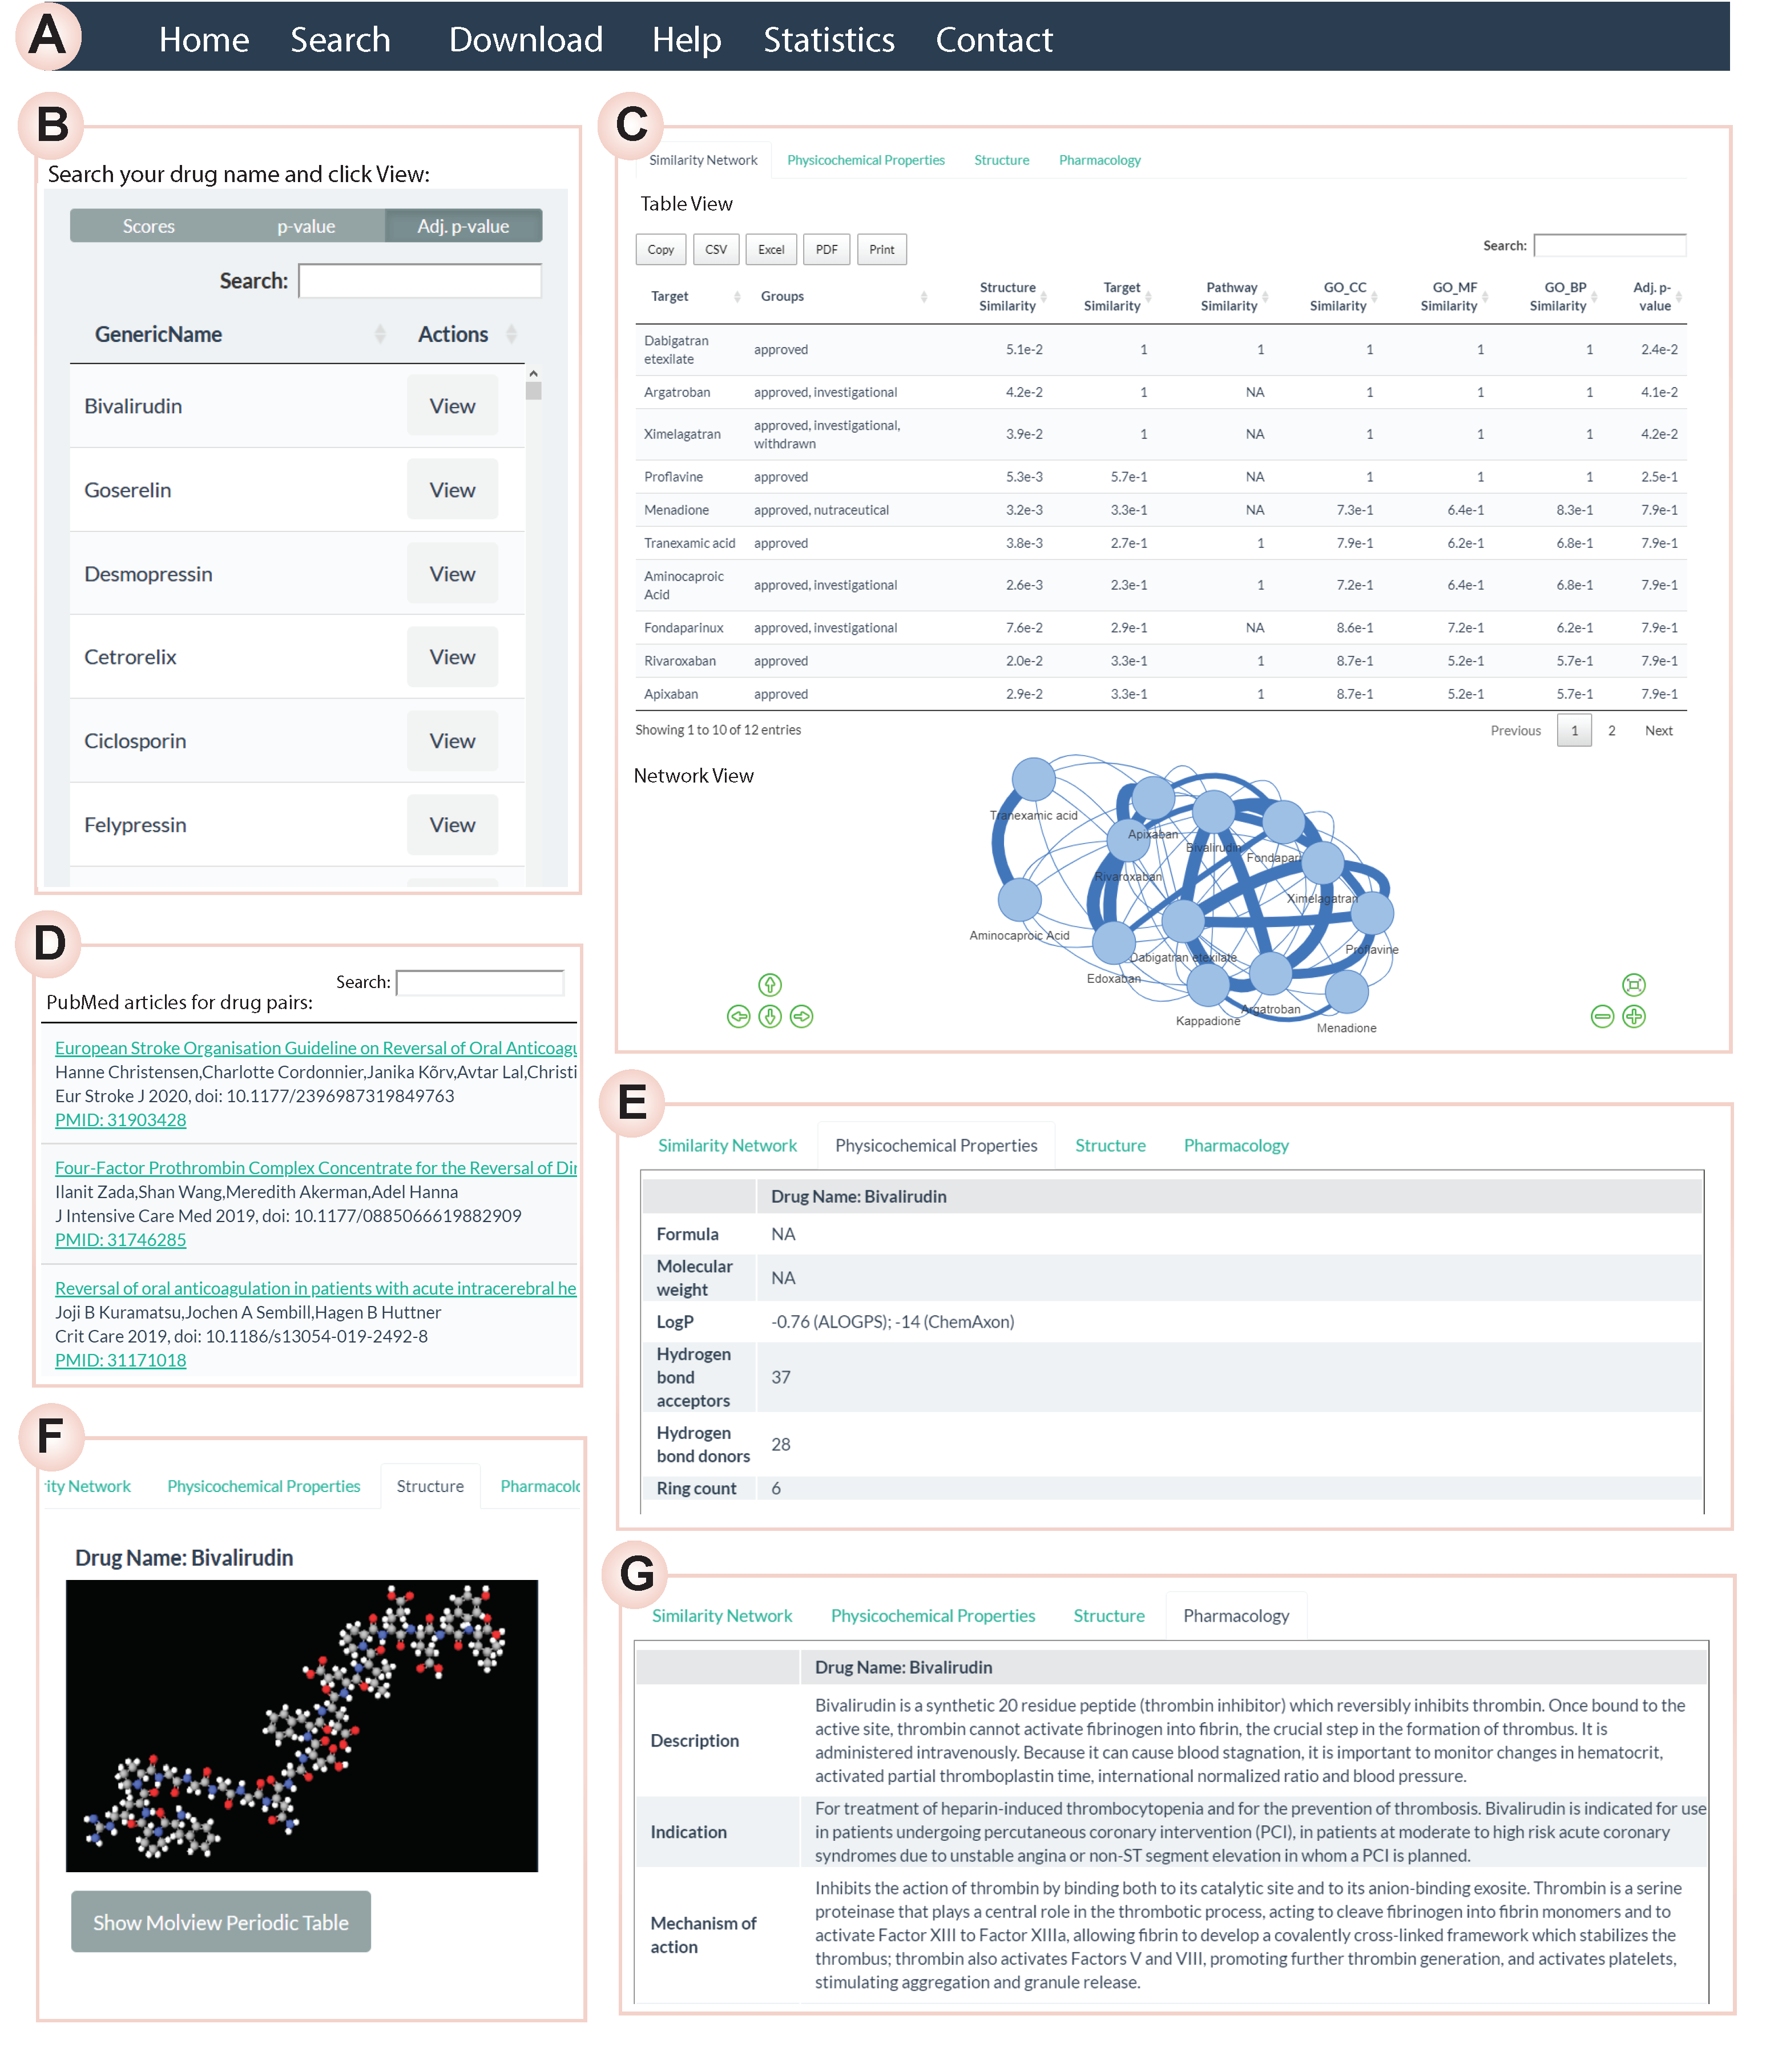
<h2 id="the-web-explorer">The web explorer</h2>

<figure>
  <img src="/images/drugsimdb_webserver.png" alt="Screenshot of the DrugSimDB web server" loading="lazy" />
  <figcaption>The R Shiny interface for searching, filtering and exporting drug similarities.</figcaption>
</figure>

<p>With the interactive app you can:</p>

<ul>
  <li>search a drug and inspect its side effects (from SIDER);</li>
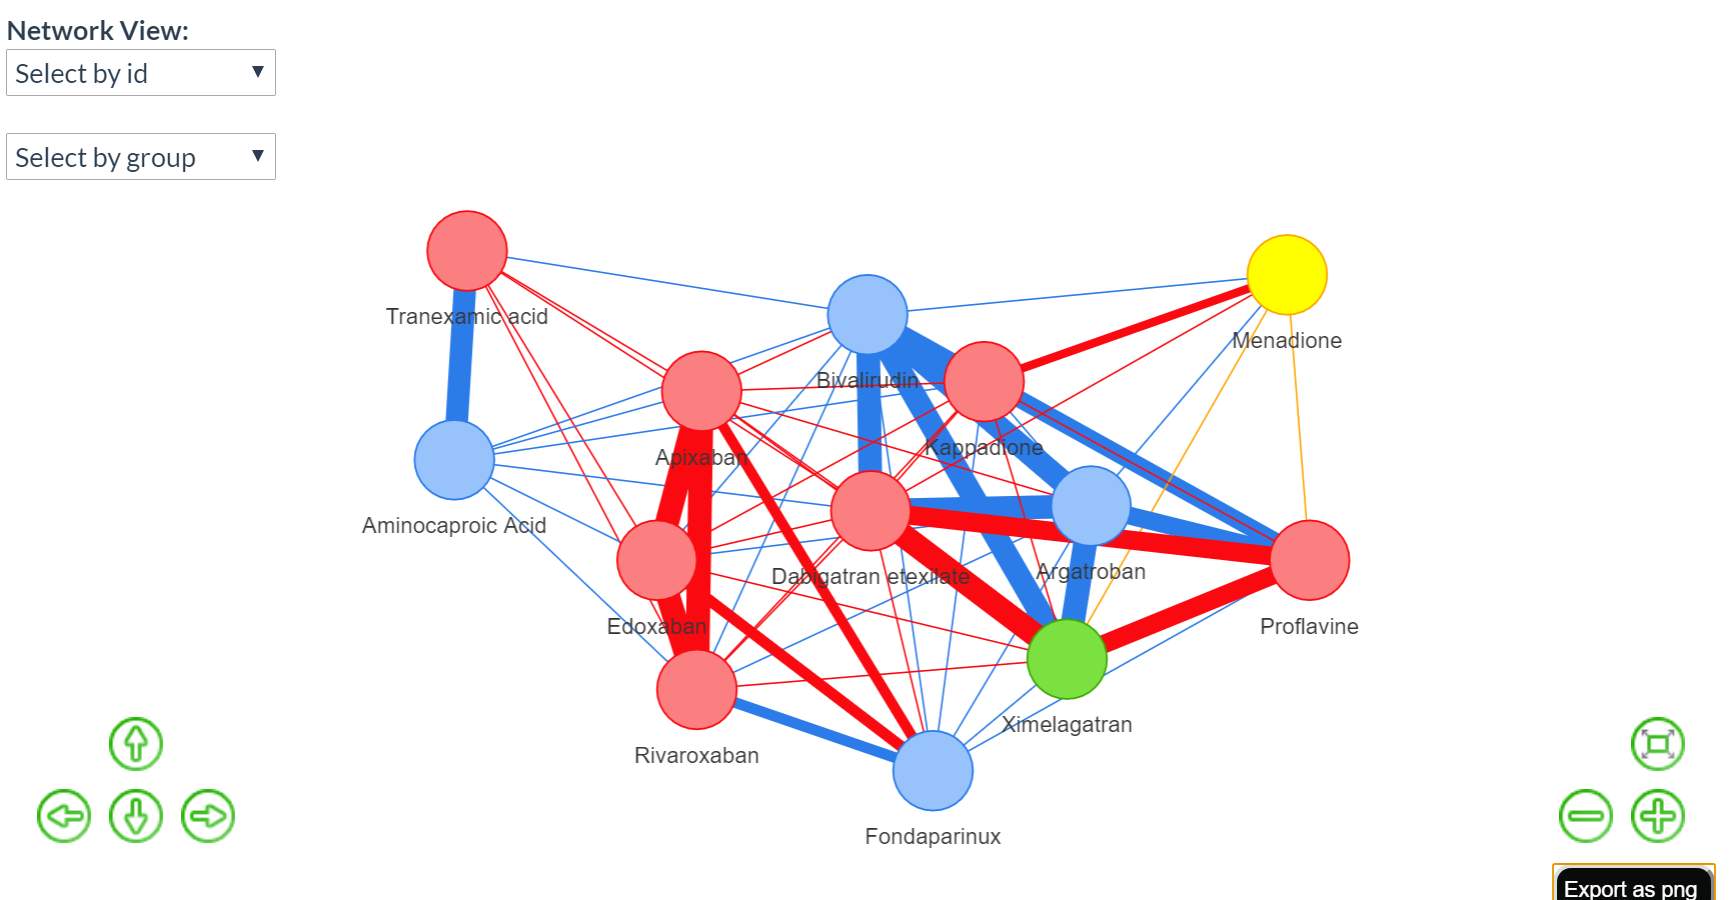
  <li>explore its <strong>similarity network</strong>, or switch to a table view;
<img src="/images/drugSimDB_search_NetworkView.png" alt="Network view of a drug's similarity neighbourhood" /></li>
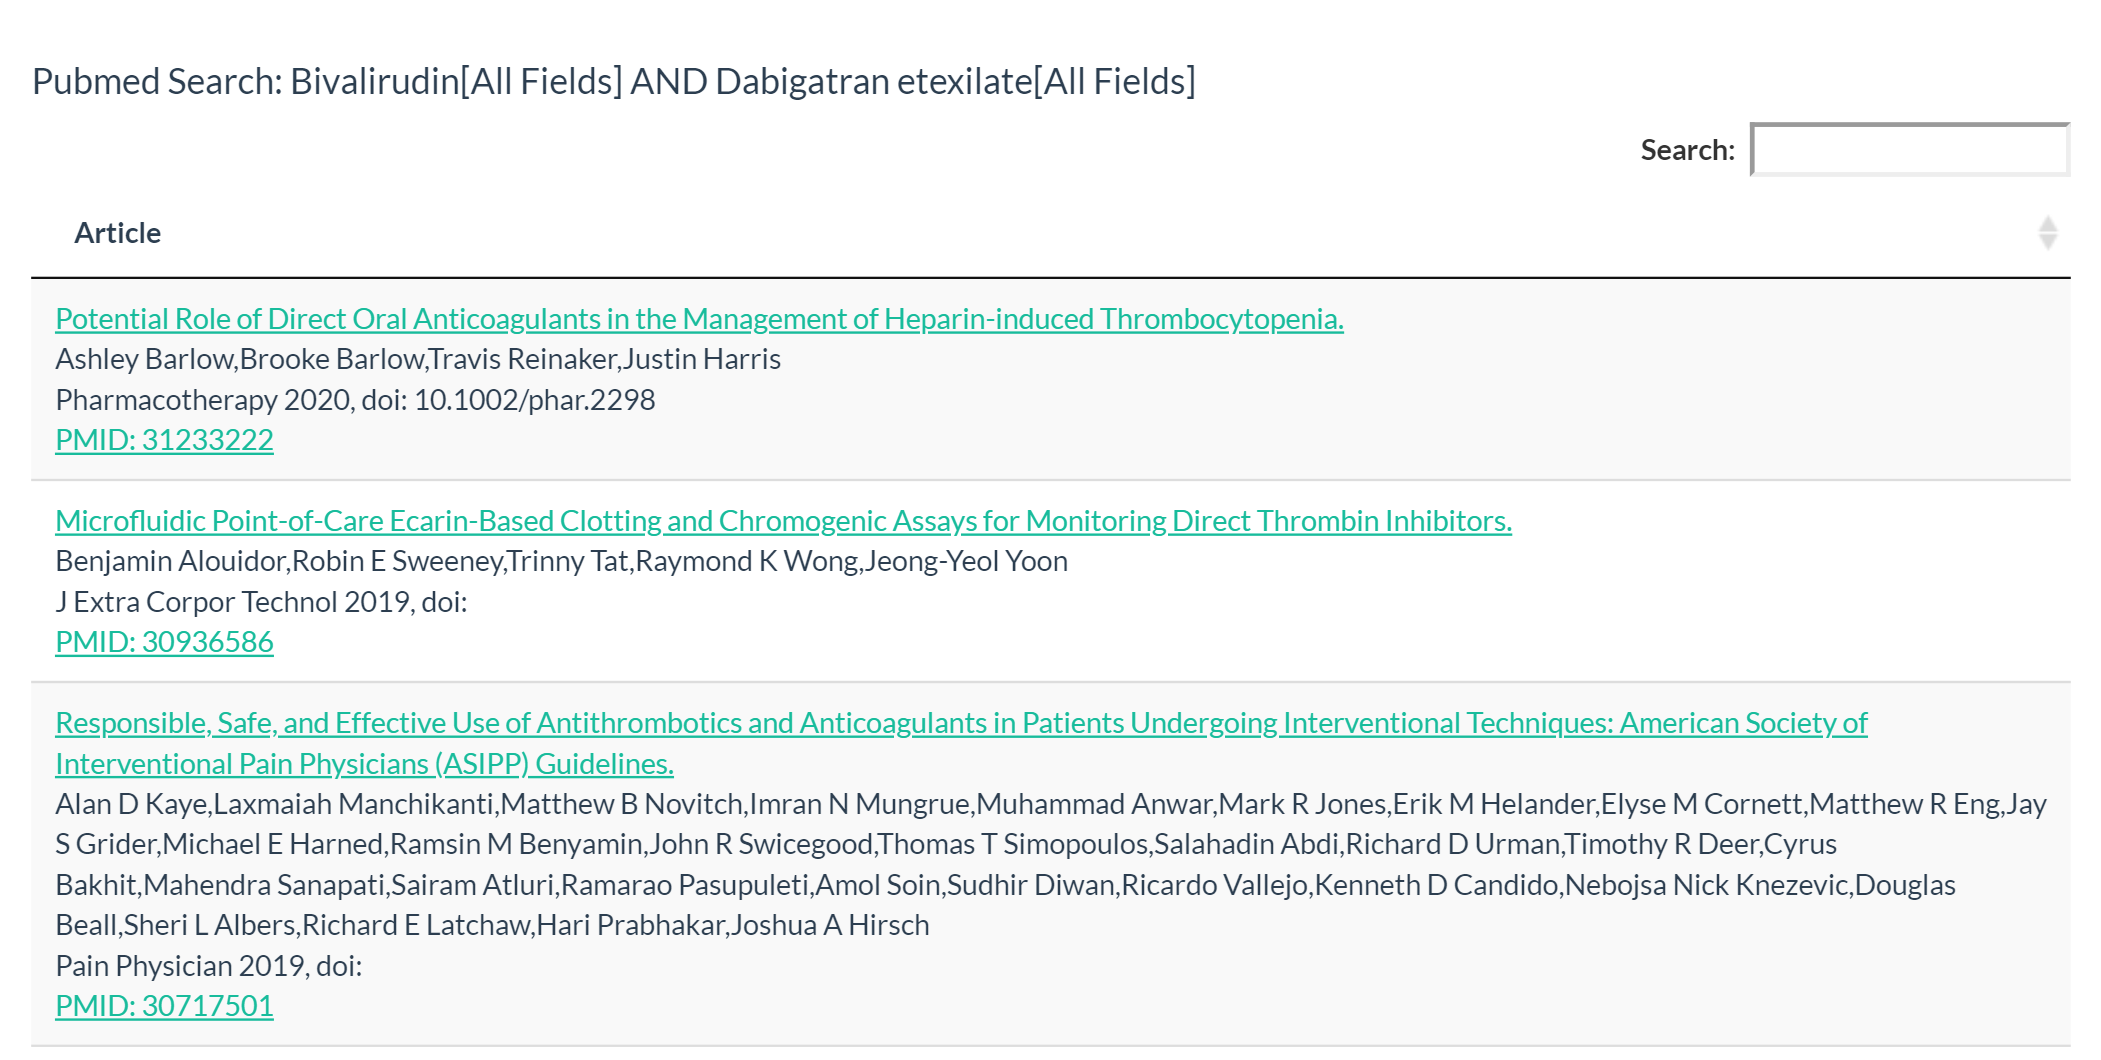
  <li>hover over a node for drug information, or click an edge to retrieve <strong>PubMed evidence</strong> for that drug pair;
<img src="/images/drugSimDB_pubmedSearch.png" alt="PubMed evidence for a drug pair" /></li>
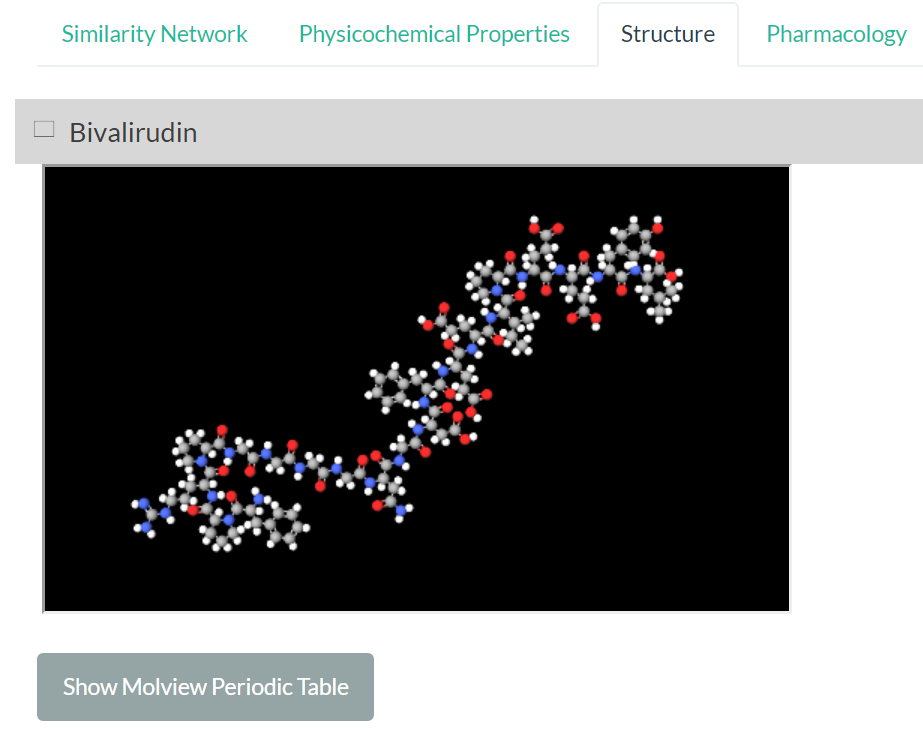
  <li>view <strong>3D chemical structures</strong> and browse physicochemical and pharmacological properties.
<img src="/images/drugSimDB_visualizedrug3D.png" alt="3D structure viewer" /></li>
</ul>

<h2 id="use-cases">Use cases</h2>

<ul>
  <li><strong>Drug repositioning:</strong> rank candidates by similarity to drugs with a known indication.</li>
  <li><strong>Side-effect and drug–drug-interaction hypotheses:</strong> similar drugs often share adverse-event profiles.</li>
  <li><strong>Network medicine:</strong> run community detection, random walks or graph neural networks on the similarity network.
DrugSimDB’s multi-evidence similarity also powers our <a href="/blog/2021/covid-cdr-combination-therapy/">COVID-CDR</a>
platform and the proposed <strong>Onco-CDR</strong> platform for cancer combination therapy.</li>
</ul>

<h2 id="access">Access</h2>

<ul>
  <li>Web app: <a href="https://unsw-data-analytics.shinyapps.io/DrugRepo/">unsw-data-analytics.shinyapps.io/DrugRepo</a></li>
  <li>Full database download: <a href="https://figshare.com/articles/dataset/DrugSimDB/11948904">figshare</a></li>
  <li>Code: <a href="https://github.com/Akmazad/DrugSimDB">github.com/Akmazad/DrugSimDB</a></li>
</ul>]]></content><author><name>AKM Azad</name></author><category term="drug repositioning" /><category term="drug similarity" /><category term="network medicine" /><category term="database" /><category term="R Shiny" /><summary type="html"><![CDATA[10,367 small-molecule drugs and 238,635 significant drug pairs, built by integrating chemical, target-sequence, functional and pathway evidence into one extensible similarity network with an interactive web explorer.]]></summary><media:thumbnail xmlns:media="http://search.yahoo.com/mrss/" url="https://akmazad.github.io/assets/img/og-card.png" /><media:content medium="image" url="https://akmazad.github.io/assets/img/og-card.png" xmlns:media="http://search.yahoo.com/mrss/" /></entry><entry><title type="html">XTalkiiS: predicting pathway cross-talk within and between species</title><link href="https://akmazad.github.io/blog/2018/xtalkiis-inter-species-cross-talk/" rel="alternate" type="text/html" title="XTalkiiS: predicting pathway cross-talk within and between species" /><published>2018-10-13T00:00:00+03:00</published><updated>2018-10-13T00:00:00+03:00</updated><id>https://akmazad.github.io/blog/2018/xtalkiis-inter-species-cross-talk</id><content type="html" xml:base="https://akmazad.github.io/blog/2018/xtalkiis-inter-species-cross-talk/"><![CDATA[<p>Cells communicate through <strong>pathway cross-talk</strong>, and in silico studies of cross-talk within a single species have
helped decode disease phenotypes. Many diseases, though, involve <strong>two organisms</strong>: a host and a pathogen or
parasite, such as <em>Plasmodium</em> in malaria. Predicting cross-talk <em>between</em> species in a data-driven way had not been
explored. <strong>XTalkiiS</strong> (Cross-talks between inter-/intra-species pathways) set out to do it.</p>

<!--more-->

<h2 id="the-hypothesis">The hypothesis</h2>

<p>If we measure the expression of pathway components (genes or proteins) <strong>simultaneously in matched samples of
both organisms</strong>, as dual RNA-seq of infected tissue allows, we can build a <strong>data-driven network</strong> that spans
both species. Co-expression edges between a host pathway and a parasite pathway then become candidate
<strong>inter-species cross-talks</strong>.</p>

<h2 id="how-xtalkiis-works">How XTalkiiS works</h2>

<ol>
  <li><strong>Retrieve pathways.</strong> Using KEGG’s RESTful API and an in-house crawler (shared with
<a href="/blog/2018/kpgminer-kegg-pathway-genes/">KPGminer</a>), XTalkiiS lists up-to-date pathway information for
every species in KEGG.</li>
  <li><strong>Load a data-driven network</strong> of pathway components, within one organism or across two.</li>
  <li><strong>Model cross-talk.</strong> A cross-talk modelling approach in the spirit of our
<a href="/blog/2018/xdamosin-cross-talk-categorisation/">Type-I/Type-II categorisation</a> determines which pairs of known
KEGG pathways interact in the selected organism(s).</li>
  <li><strong>Report</strong> intra-species and inter-species cross-talks for downstream interpretation.</li>
</ol>

<h2 id="why-it-matters">Why it matters</h2>

<p>Inter-species cross-talk opens a way to ask <strong>how host and parasite pathways interact</strong> to produce a phenotype
such as malaria pathogenesis, and therefore which host pathways a parasite exploits. This idea fed directly into
later dual RNA-seq work on host–pathogen dynamics (dRNASb, <em>Microbial Genomics</em>, 2022) and an MS project at
Monash on mechanisms of drug resistance in malaria.</p>

<h2 id="get-it">Get it</h2>

<ul>
  <li>Source: <a href="https://github.com/Akmazad/XTalkiiS">github.com/Akmazad/XTalkiiS</a></li>
  <li>Binaries: <a href="https://sourceforge.net/projects/xtalkiis/">sourceforge.net/projects/xtalkiis</a></li>
</ul>]]></content><author><name>AKM Azad</name></author><category term="software" /><category term="pathway cross-talk" /><category term="host-pathogen" /><category term="KEGG" /><category term="inter-species networks" /><summary type="html"><![CDATA[A tool that builds data-driven pathway networks and predicts cross-talk among KEGG pathways within one organism (intra-species) or between two, such as host and parasite (inter-species).]]></summary><media:thumbnail xmlns:media="http://search.yahoo.com/mrss/" url="https://akmazad.github.io/assets/img/og-card.png" /><media:content medium="image" url="https://akmazad.github.io/assets/img/og-card.png" xmlns:media="http://search.yahoo.com/mrss/" /></entry></feed>